sortalyzer
Live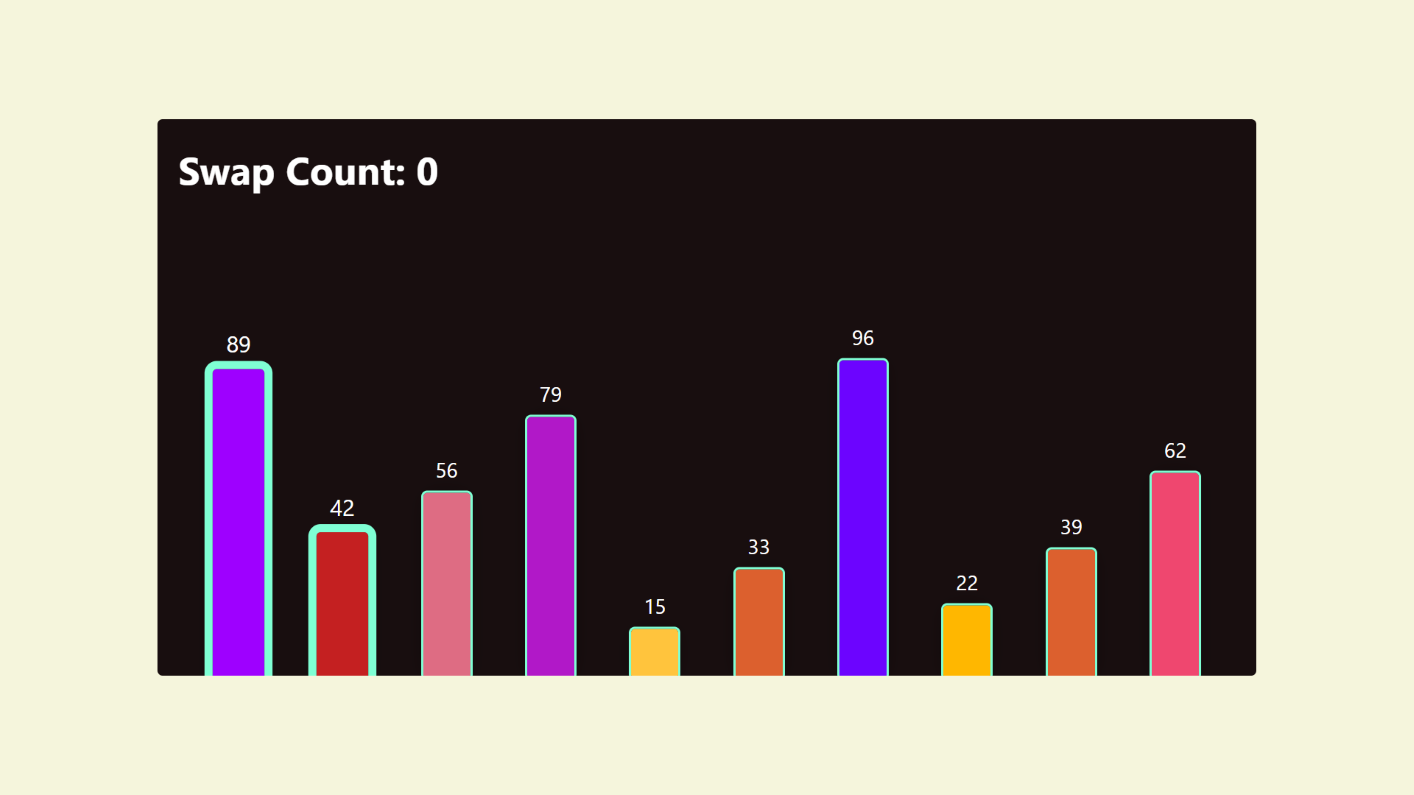
motivation
At the start of my journey into learning one of the most fundamental and beautiful areas in computer science, Data Structures & Algorithms, I was amazed at how many of these powerful tools and concepts there were. It felt as though a curtain was unveiled from the many technologies I use and rely on each and every single day. Technologies that, at their core, are built upon these elegantly crafted algorithms, which themselves are the result of years upon years—if not centuries upon centuries—of reasoning and experimenting. Many of which I'd often taken for granted—technologies that provide functionalities like how the operating system on my computer stores files and provides me with an easy-to-use interface for managing them, how my phone seemingly knows exactly what word I was looking for, and how the pixels are drawn to my screen when viewing any form of media. Simply put, I realized I had a long and wonderful journey ahead of me.
When I started, I was first introduced to the simpler naive comparison sorting algorithms, which I thought were a lovely way to dip my toes into the world of Data Structures & Algorithms. The Saturday of that week at 2:00 AM, I had the random urge to try to build a visualizer for Bubble Sort, an algorithm I had recently learned. I thought it would be a fun way to solidify the concepts I'd just learned—and it did exactly that. I was very pleased as I watched as the bars in my graph politely slid to their sorted positions.
tech
process
Initially, I thought to myself, "This would be a great time to try out and learn D3.js!" D3.js is a very popular JavaScript library for visualizing data and, honestly, from the examples I'd seen, it seemed like a perfect fit for this project. However, I, again, wanted to challenge myself and start with nothing but React and Framer Motion. Overwhelmed at first, I decided to start with small questions like: "How would I render the vertical bars of the graph?" After a bit of fiddling with the markup and CSS, I had the basis for my Bar component.
A great start! Now I had to think about how was I going to render bars of different heights based on the integer value they are representing. Well, before this, I needed some data. A simple function to generate an array of random integers with an adjustable size parameter will do. Now, with my array of random data points itching to be visualized, I had to figure out a way to give each bar a height based on the number it was representing. Opting for a simple approach, I added some inline styling to dynamically set the height of the bar based on a ratio between the integer value and the height of the browser window. This way, along with a resize event listener, the height of the bars could scale according to the current height of the browser window. I was happy with the results and took a moment to appreciate the bars of varying heights now visible on my screen.
Now time for the actual algorithm. This being my first attempt at visualizing an algorithm, I had no idea what I was in for. I was already pretty comfortable working in React at this point, but again, I'd never done something like this before! I took a breather and reminded myself, "One step at a time."
First, I implemented the Bubble Sort algorithm, then I had to take a bit of time to think... "What states would I need to be able to properly visualize the swaps I'm performing?" It was simply just the data itself! All I "really" had to do was update the state of the data after each swap to reflect the changes!
At this point, if I were to run the algorithm, the bars would seem to just teleport to their final sorted order. This was due to React batching state changes to prevent unnecessary rerenders, a process in line with the rendering pipelines of the many browsers we know and love. Since I was updating the state of the bars on each iteration within my loops, it wouldn't matter how many times I called the state setter function—only the final change, the fully sorted data, would be rendered. This was definitely not what I was aiming for! I figured that what I needed was a way to pause the execution of the algorithm to allow time between these swaps for React to update the screen. A need for some asynchronous programming.
An idea popped into my head: "What if I used the (lovely) promise API to create a Promise that would resolve after a short, arbitrarily selected period of time?" This would give React a chance to visually update the bar's current positions in between these swaps. In essence, all this means is that after each swap the algorithm performs, it could take an algorithmic break (a well-deserved one at that!) to allow React to render the changes. Perfect! The bars were now being swapped, two at a time, and things looked good! But wait, the bars were just statically appearing in their new positions! This wasn't too visually appealing and, again, definitely wasn't what I was aiming for!
Cue, Framer Motion! Framer provides a wonderful primitive called "layout" that magically lets us add a transition (a simple, straightforward animation) directly to the Bar components. Any layout changes made to the Bars would be smoothly transitioned for us! Framer is truly magical, in this regard and many others, and did a lot of the dirty work for us here. I'm sure I could've learned a ton trying to achieve a similar effect with React's useTransition hook and the FLIP animation technique (ANDDDDDDDDDDD the project ideas folder grows...), however, I wanted to focus on the main goal of my late-night endeavor, to visualize a sorting algorithm.
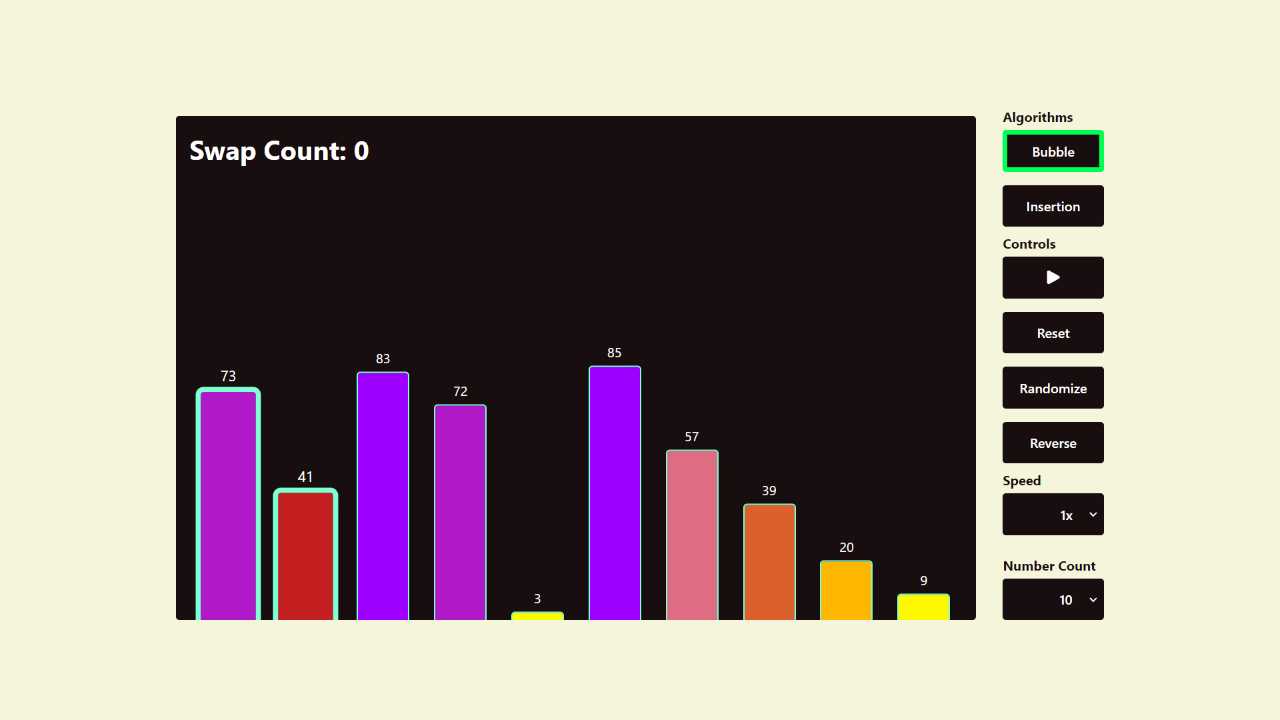
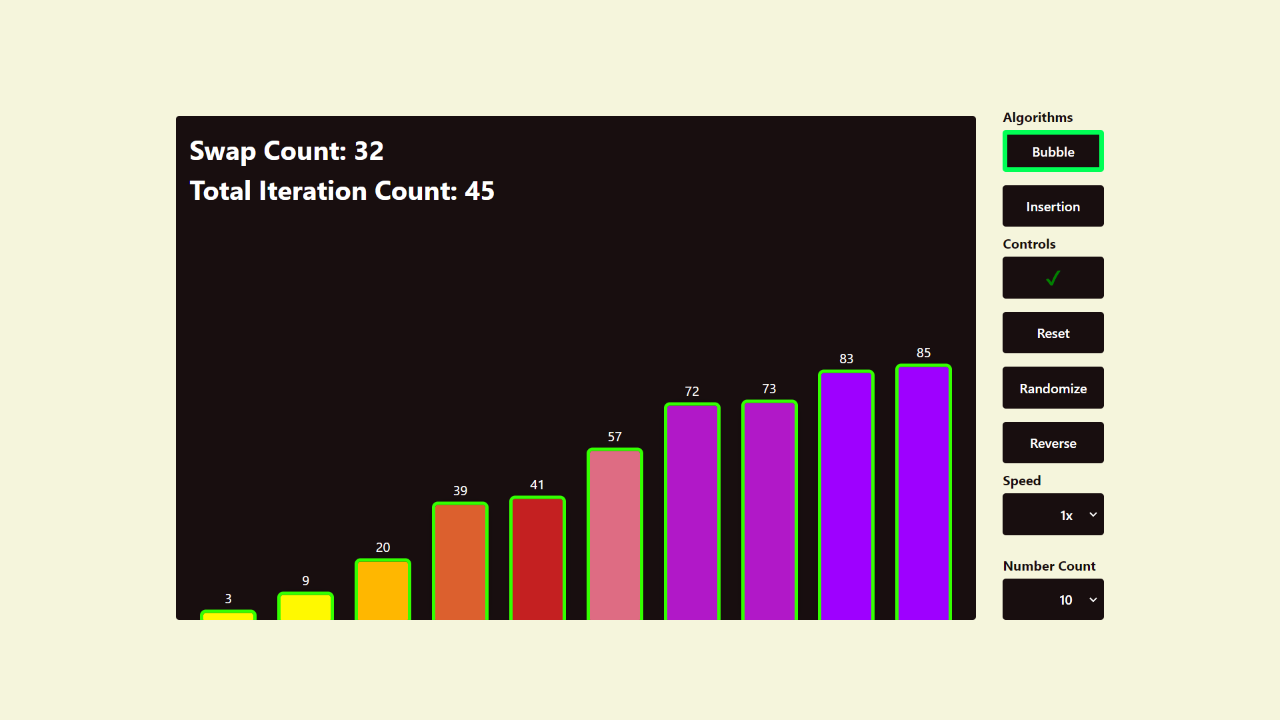
The core of the application was done, and I was happy with the implementation. To give myself more control, I then quickly whipped up a couple of inputs that would allow me to easily change the speed of the swaps, the number of bars, and a button to generate a new set of randomized data points. Me and my friends then watched in glee as these bars politely scooted over to their final sorted positions.
outcome
A sorting algorithm visualizer that comes with pause and play functionality, buttons for randomization, reversal and resetting of state, as well as adjustable inputs for swap speed and the number of data points to visualize. Currently, it has support for the Bubble and Insertion naive comparison sorting algorithms. Overall, I consider this spontaneous project, which began on a late Saturday night, a success! Visualizing algorithms has become a favorite in my coding endeavors and I am gradually building up a collection of creative coding projects.
struggles, insights, and more
As with any project, especially those where you're pushing yourself to do something new, you will be challenged. There will be mountains to climb and hurdles to overcome. One of the biggest struggles I encountered throughout this process was the pause/play functionality, something I seemingly glossed over in the process section. I had to consider how exactly I was going to capture the iteration count the two loops were on to achieve resumability. I reached for the 'useRef' hook in this case, as it allowed me to persist data between renders that my components weren't visually dependent on. The ref object would store an array of my current counters—'i' for the outer loop and 'j' for the inner loop. At the end of each iteration, I would have to update these values in a way that ensured, upon unpausing, there would be no out-of-bounds issues. Admittedly, this took more hours than I cared to count to get fully working, but once done I now had pause and play functionality, along with a solid understanding of how to extend this feature to future algorithms the project would support!
Another issue that I ran into, common in React, was handling duplicate data. React will complain if, first, components in a list do not have keys, which are just identities for the component that React uses to manage the component tree; second, if multiple components have the same keys. To solve this issue, I brought another library into the project, Nano ID. This tiny library (116 bytes minified!!!!) would allow me to generate unique string IDs to use as the key for all of my data points. After a bit of refactoring, this classic issue was handled.
I am very glad I acted upon the late-night urge I had to code this up. It challenged me to tie together React and asynchronous programming in a new and creative way, and I'm all the better for it. This project marked a pivotal point in my journey. One that would lay the foundation for all of my future creative coding projects.
future plans
In its current state, there is only support for two algorithms, as I mentioned. Bubble Sort and Insertion Sort. When time allows, I will be bringing in Selection Sort to complete the trio of the most well-known naive comparison sorting algorithms. I also plan on visualizing the very popular and powerful Divide and Conquer sorting algorithms, Merge Sort, and Quick Sort.
One optimization I want to implement is a complete refactor to using the Canvas API for these visualizations instead of relying on the DOM. DOM manipulations are not cheap and moving to canvas would allow for rendering much larger sets of data.
As I delve deeper into the beautifully diverse world of Data Structures & Algorithms, I am excited to visualize as many as I possibly can! Visualizing algorithms has been a very fun and enjoyable activity for me, as this project first taught me. It personally helped me solidify a lot of what I learned. A big goal of mine is to eventually visualize the very powerful A* pathfinding algorithm.
This write-up is getting quite lengthy, so that's it for now! Thank you for reading through this description of a project that marked the start of my ever-growing appreciation for these wonderful algorithms that have evolved over some of the most revolutionary decades for humankind and are free for anyone to learn at the click of a button.